MERRA/AS and Climate Analytics-as-a-Service (CAaaS)
information technology and software
MERRA/AS and Climate Analytics-as-a-Service (CAaaS) (GSC-TOPS-53)
Ease of access to over 400 climate variables for any location on the earth
Overview
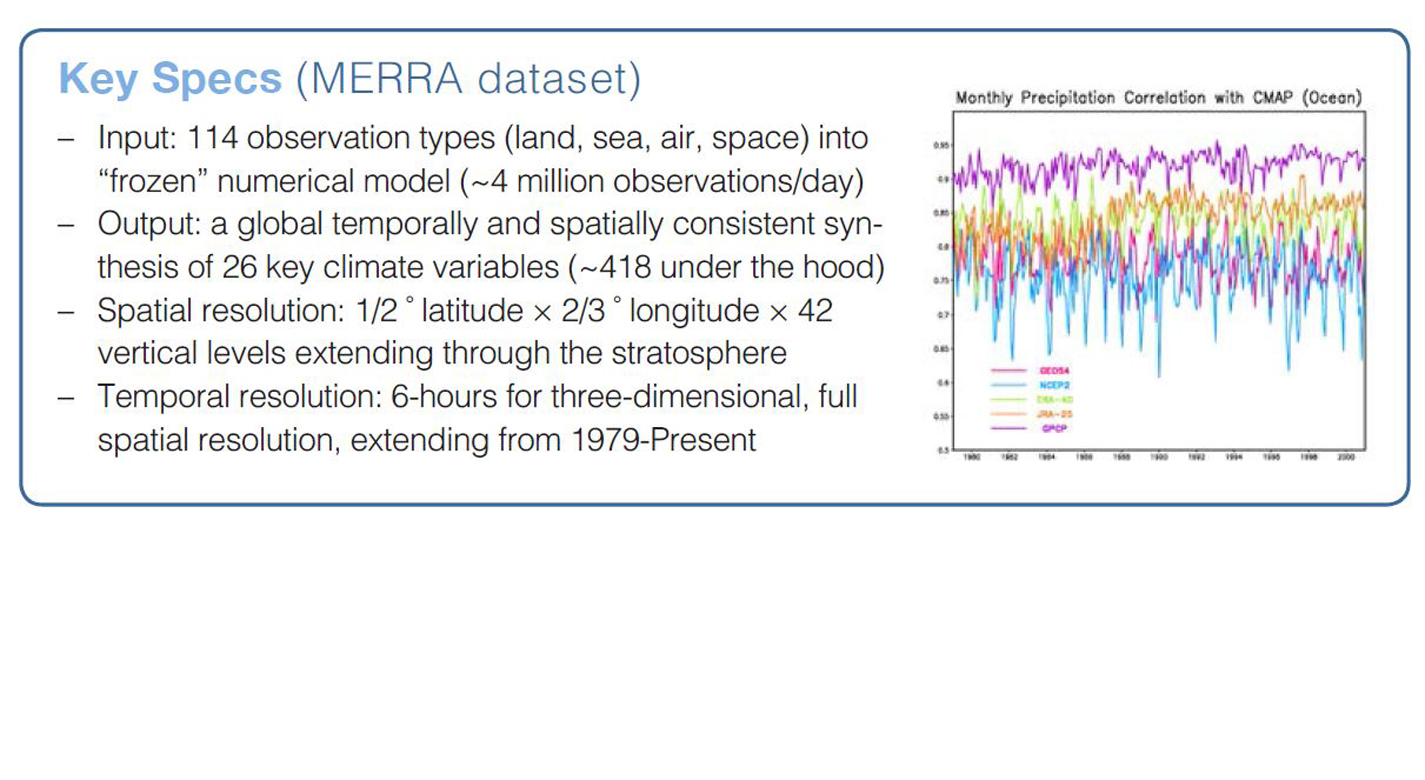
The Modern Era-Retrospective Analysis for Research and Applications (MERRA) integrates data from a variety of satellite systems with numerical models to produce a temporally and spatially consistent synthesis of climate variables that are not easily observed. MERRA provides global coverage. The MERRA time period covers the modern era of remotely sensed data, from 1979 to the present.
The breadth of MERRA variableswhich include atmosphere, ocean, and land surface productsmakes MERRA ideal for investigating climate variability and for use in an expanding array of applications areas, such as national disasters, civil engineering, ecological forecasting, health and air quality, water resources, and agriculture. However, these data sets are hundreds of terabytes in size, growing to petabytes in size over the coming years. Despite their utility, it is often difficult to use this important information.
The Technology
NASA Goddard Space Flight Center now offers a new capability for meeting this Big Data challenge: MERRA Analytic Services (MERRA/AS). MERRA/AS combines the power of high-performance computing, storage-side analytics, and web APIs to dramatically improve customer access to MERRA data. It represents NASAs first effort to provide Climate Analytics-as-a-Service.
Retrospective analyses (or reanalyses) such as MERRA have long been important to scientists doing climate change research. MERRA is produced by NASAs Global Modeling and Assimilation Office (GMAO), which is a component of the Earth Sciences Division in Goddards Sciences and Exploration Directorate. GMAOs research and development activities aim to maximize the impact of satellite observations in climate, weather, atmospheric, and land prediction using global models and data assimilation. These products are becoming increasingly important to application areas beyond traditional climate science.
MERRA/AS provides a new cloud-based approach to storing and accessing the MERRA dataset. By combining high-performance computing, MapReduce analytics, and NASAs Climate Data Services API (CDS API), MERRA/AS moves much of the work traditionally done on the client side to the server side, close to the data and close to large compute power. This reduces the need for large data transfers and provides a platform to support complex server-side data analysesit enables Climate Analytics-as-a-Service.
MERRA/AS currently implements a set of commonly used operations (such as avg, min, and max) over all the MERRA variables. Of particular interest to many applications is a core collection of about two dozen MERRA land variables (such as humidity, precipitation, evaporation, and temperature). Using the RESTful services of the Climate Data Services API, it is now easy to extract basic historical climatology information about places and time spans of interest anywhere in the world. Since the CDS API is extensible, the community can participate in MERRA/ASs development by contributing new and more complex analytics to the MERRA/AS service.
MERRA/AS demonstrates the power of CAaaS and advances NASAs ability to connect data, science, computational resources, and expertise to the many customers and applications it serves.


Benefits
- Reduces the need for large data transfers
- Provides a comprehensive set of climate variables
- Provides one stop shopping for historic climate data
- Provides significant time savings in data gathering
- Enables easy API-based application development
- Enables customization through an extensible API
- Enables fast data subsetting and basic operations
- Provides a platform for complex data analytics
Applications
- Energy
- Insurance
- Agriculture
- Urban planning
- Water management
- Ecological forecasting
- Resource management
Technology Details
information technology and software
GSC-TOPS-53
GSC-17116-1
GSC-17117-1
GSC-17115-1
GSC-17118-1
GSC-16594-1
GSC-17966-2
GSC-17967-2
GSC-17971-2
GSC-17973-2
Schnase, J., Duffy, D., Tamkin, G., Nadeau, D., Thompson, J., Grieg, C., . . . Webster, W. (2014). MERRA Analytic Services: Meeting the Big Data challenges of climate science through cloud-enabled Climate Analytics-as-a-Service. Computers, Environment and Urban Systems.
Similar Results

Space Weather Database Of Notifications, Knowledge, Information (DONKI)
The Space Weather DONKI builds a catalog of past, present, ongoing, and expected Space Weather events. The catalog contains both forecaster logs and notifications. DONKI version 2.0 of has a comprehensive web-service API access for users to obtain space weather events stored in the database. The database consists of a backend and a web application. The database uses a framework that allows modularization of code and promotes code reuse.
DONKI is the first application to allow space weather scientists to store all space weather events in one centralized data center. The comprehensive database provides search capability to support scientists allowing them to look into linkages, relationships, and cause-and-effects between space weather activities.

Grid-Oriented Normalization for Analysis of Spherical Areas (GONASA)
NASA's GONASA technology is a mathematical formula / algorithm built around creating a grid composed of equal-area cells that span the entire visible hemisphere of a spherical object. Traditional longitude and latitude grids produce cells that diminish in size toward the poles due to convergence of longitudinal lines. GONASA circumvents this problem by carefully adjusting the latitude increments, resulting in a network of truly equal-area cells. This adjustment ensures that any feature observed on the spherical surface is accurately represented, regardless of its location.
To implement GONASA, the spherical surface is first segmented into discrete latitude bands or rings, each chosen to encompass an identical surface area. Within each ring, longitude divisions maintain equal cell areas, creating a uniform Cartesian grid. The result is a consistent, distortion-corrected matrix suitable for automatic computation, enabling simplified, efficient, and accurate measurements of spatial characteristics such as feature area, centroid location, perimeter, compactness, orientation, and aspect ratio.
GONASA grids are computationally efficient and readily adaptable to a range of data processing workflows, from spreadsheets to sophisticated data analysis frameworks like Pandas data frames in Python. Due to their consistent cell sizing and straightforward indexing, GONASA grids facilitate automation, enabling rapid, high-volume data processing and analysis, essential for modern remote sensing and planetary missions that require immediate, reliable data analysis in limited-bandwidth communications environments. At NASA, GONASA has already been successfully implemented to study images of Titan (e.g., mapping its clouds) taken by the Cassini space probe.

Kodiak 3D Lidar
NASA Goddard Space Flight Center has developed a 3D lidar system that consists of microelectromechanical systems (MEMS) beam steering, high performance reconfigurable computing, and an in-depth understanding of systems level integration. Kodiak combines a 3D MEMS scanning lidar with a long range narrow FOV telescope to produce a flexible and capable space flight ranging system. Also included is SpaceCube-level processing power to host a variety of algorithms enabling sensing and 6 degrees of freedom.

WindiWing: Atmospheric Data Collection Line Climber
This innovative kite system is called the WindiWing, and utilizes aerodynamic forces and moments to control its configuration for both ascent and descent, eliminating the need for an external power source or human intervention. By harnessing wind power, the system autonomously climbs and descends along a pilot kite line, provided sufficient wind conditions exist.
Windiwing includes a set of stops at predetermined upper and lower bounds of the kite line, which define the highest and lowest points the WindiWing can travel. When a stop is hit, the WindiWing changes direction. Therefore, it can sustain extended flight times at different altitudes. Unlike prior solutions, WindiWing is a passive line-climber operating entirely through aero-mechanical principles and does not require electrical power or active control systems for changes in lift. Instead, WindiWing continuously moves between the designated stops along the kite tether, maintaining stable and predictable movement without the need for remote operation or onboard power.
WindiWing is designed with flexibility in mind, offering the ability to carry a range of instrumentation, making it suitable for integration with kite-based systems, tethered balloons, or uncrewed aircraft platforms. The absence of electrical components reduces complexity, enhances reliability, and allows for extended atmospheric data collection with minimal oversight.
By offering a scalable, cost-effective, and power-independent solution, this technology enables long-duration atmospheric profiling at various altitudes, making it an ideal tool for researchers in the fields of atmospheric research, environmental research, and education.

Flight Awareness Collaboration Tool (FACT)
The Flight Awareness Collaboration Tool (FACT) user interface is a quad design with four areas. The Primary Map View shows the US with several traffic and weather overlays. The Surface Map View displays the selected airport with information on runway conditions and other factors. The Information View has specific data from various sources about the area of interest. This view also has a built-in algorithm that predicts the impact of the forecast winter weather on airport capacity. The Communication View supports messaging within the geographically-dispersed team that is using FACT. When an airport is selected in the Primary Map View, the information presented in the Surface Map and Information Views is focused on that choice.
FACT is a web-based application using Node.js and MongoDB. It receives Java messages from the Federal Aviation Administration System Wide Information Management (SWIM) data repository. Data acquired from web pages and SWIM are tailored for FACTs Information View area. FACT is designed to reside on an existing workstation monitor to be put into use as needed.


